Mastering Web Development: How to Effectively Debug Your Code Using Chrome and Edge Dev Tools
Introduction
Debugging is a crucial skill for any web developer. Whether you're working with HTML, CSS, JavaScript, or any other web technology, being able to identify and fix issues efficiently can save you countless hours. In this guide, we'll explore how to effectively debug your code using Chrome and Edge Developer Tools, along with some best practices to follow.
Why Debugging is Important
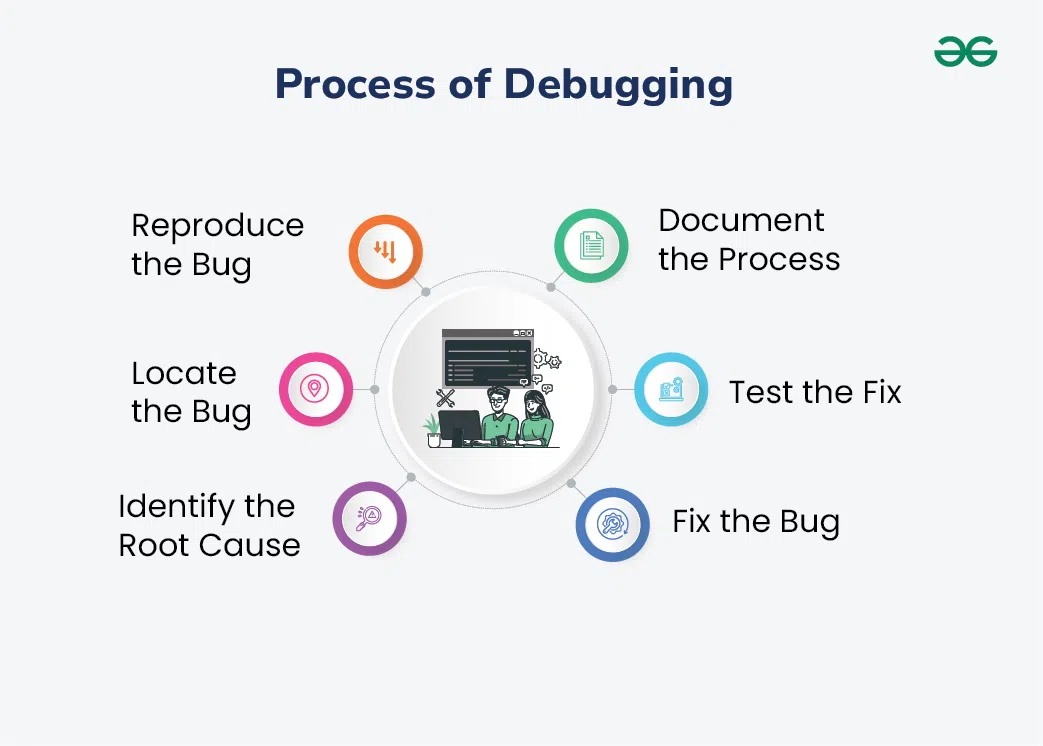
Before diving into the tools, let's discuss why debugging is so important. Debugging allows you to:
- Identify and fix errors in your code
- Improve code quality and performance
- Ensure a smooth user experience
- Learn and understand your code better
Tools You Should Use
1. Chrome Developer Tools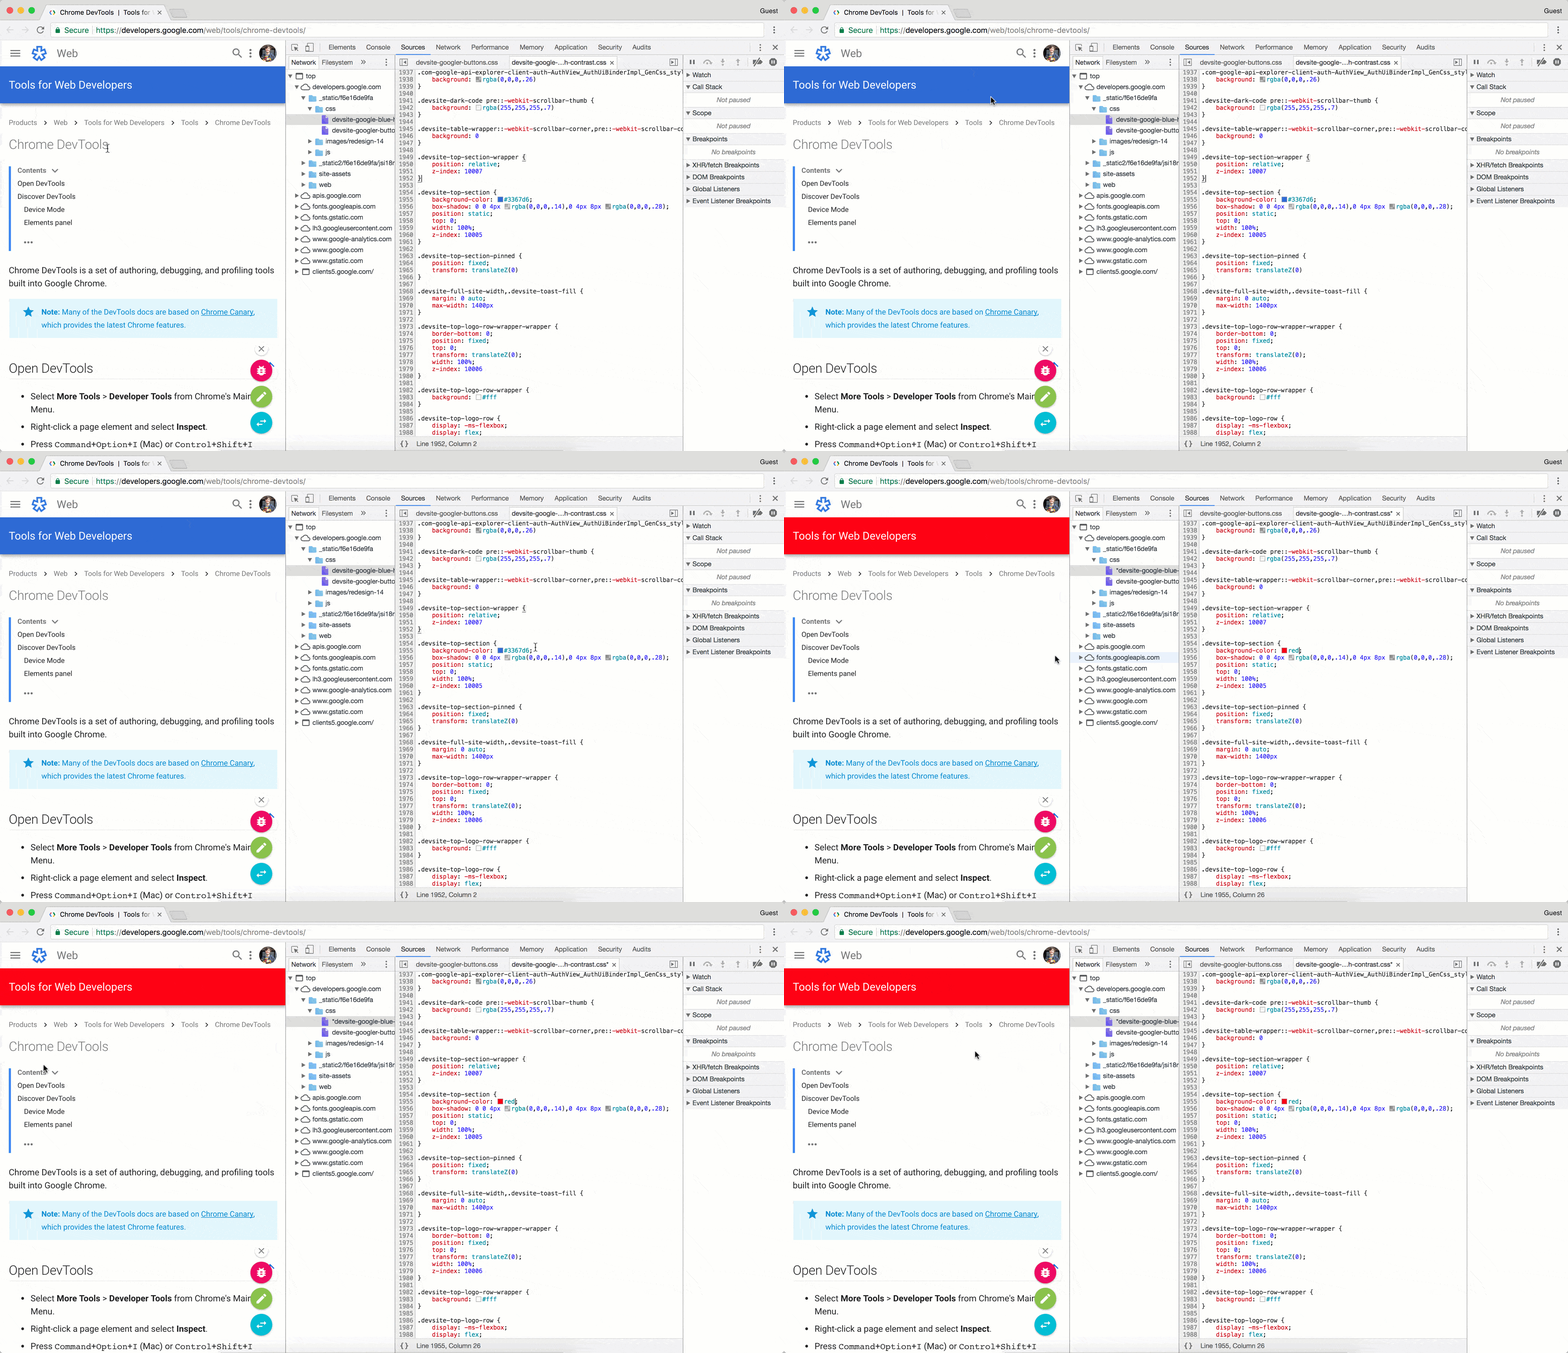
Chrome Developer Tools (DevTools) are a set of web authoring and debugging tools built into Google Chrome. They are powerful and widely used by developers for various tasks, including debugging.
Key Features:
- Elements Panel: Inspect and modify HTML and CSS in real-time.
- Console Panel: Log diagnostic information and interact with JavaScript.
- Sources Panel: Debug JavaScript, set breakpoints, and step through code.
- Network Panel: Analyze network requests and responses.
- Performance Panel: Profile the runtime performance of your application.
How to Use Chrome DevTools:
- Open DevTools: Press
F12orCtrl+Shift+I(Windows/Linux) orCmd+Option+I(Mac). - Inspect Elements: Right-click on any element and select "Inspect" to open the Elements panel.
- Console Logging: Use
console.log()to print messages to the console for debugging purposes. - Set Breakpoints: In the Sources panel, click on the line number to set breakpoints and debug your JavaScript code.
- Analyze Network: Use the Network panel to monitor network requests and identify any issues with resource loading.
2. Edge Developer Tools
Edge Developer Tools are similar to Chrome DevTools, offering a powerful set of tools for debugging web applications.
Key Features:
- Elements Panel: Inspect and edit HTML and CSS.
- Console Panel: Log messages and interact with JavaScript.
- Debugger: Debug JavaScript code, set breakpoints, and step through code.
- Network Panel: Analyze network activity.
- Performance Tools: Profile and improve performance.
How to Use Edge DevTools:
- Open DevTools: Press
F12orCtrl+Shift+I(Windows/Linux) orCmd+Option+I(Ma - Inspect Elements: Right-click on any element and select "Inspect Element."
- Console Logging: Use the console for logging and debugging JavaScript.
- Set Breakpoints: Use the Debugger panel to set breakpoints and debug your code.
- Monitor Network: Utilize the Network panel to track network requests and responses.
Best Practices for Debugging
Use Descriptive Console Logs:
- Use clear and descriptive messages in
console.log()to make it easier to understand the output. - Example:
console.log('User data loaded successfully:', userData);
Leverage Breakpoints:
- Set breakpoints in your code to pause execution and inspect the state of your application.
- Use conditional breakpoints to pause execution only when certain conditions are met.
Understand Error Messages:
- Pay attention to error messages in the console. They often provide valuable clues about what's going wrong.
- Example:
Uncaught TypeError: Cannot read property 'foo' of undefined
Use the Network Panel:
- Monitor network requests to ensure resources are loading correctly and identify any issues with APIs or external resources.
Profile Performance:
- Use performance profiling tools to identify bottlenecks and optimize the performance of your application.
- Analyze frame rates, scripting, rendering, and painting times.
How to Use Chrome DevTools: A Detailed Guide
Chrome DevTools is a comprehensive suite of tools that helps you inspect, debug, and optimize your web applications. Here's a detailed guide on using the Elements, Console, Network, Debugger, and Application tabs effectively.
1. Elements Panel

The Elements panel allows you to inspect and modify the DOM and CSS of your webpage in real time.
How to Use:
- Open DevTools: Press
F12,Ctrl+Shift+I(Windows/Linux),orCmd+Option+I(Mac). - Inspect Elements: Right-click on any element on the page and select "Inspect" to open the Elements panel.
- Modify HTML: You can edit the HTML directly by double-clicking on any element or attribute.
- Modify CSS: Similarly, you can edit CSS properties in the Styles pane on the right. Changes will reflect immediately on the webpage.
- View Event Listeners: Click on the "Event Listeners" tab to see all event listeners attached to the selected element.
Tips:
- Use the search bar (
Ctrl+ForCmd+F) to find specific elements or text within the DOM. - Right-click on elements to access additional options like "Edit as HTML" or "Copy".
2. Console Panel
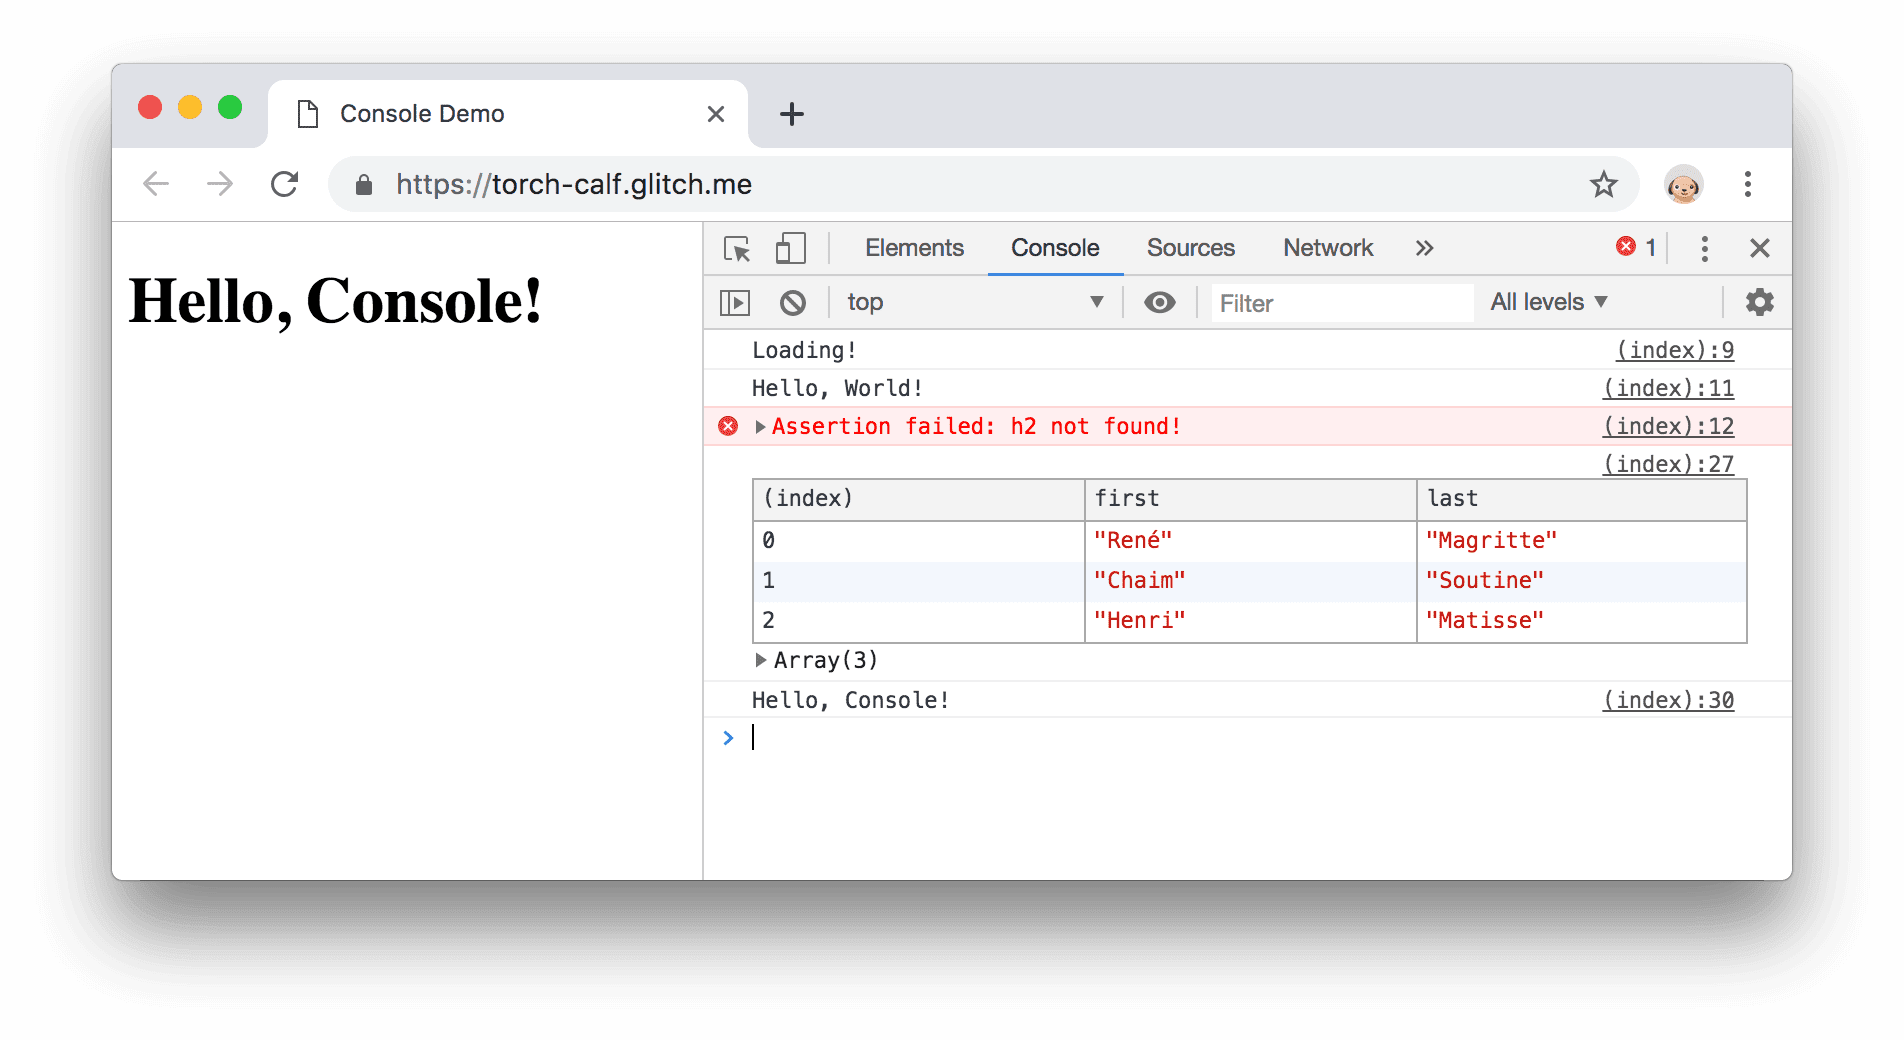
The Console panel is used for running JavaScript, logging diagnostic information, and viewing errors and warnings.
How to Use:
- Open Console: Click on the "Console" tab or press
Escwhile DevTools is open. - Log Messages: Use
console.log(),console.error(),console.warn(), andconsole.info()in your JavaScript code to log messages to the console.
console.log('Hello, world!');
- Run JavaScript: You can execute JavaScript code directly in the console.
- View Errors and Warnings: Any errors or warnings in your JavaScript code will be displayed here.
Tips:
- Use
console.table()to display data in a table format for better readability.
console.table([{name: 'Alice', age: 25}, {name: 'Bob', age: 30}]);
3. Network Panel
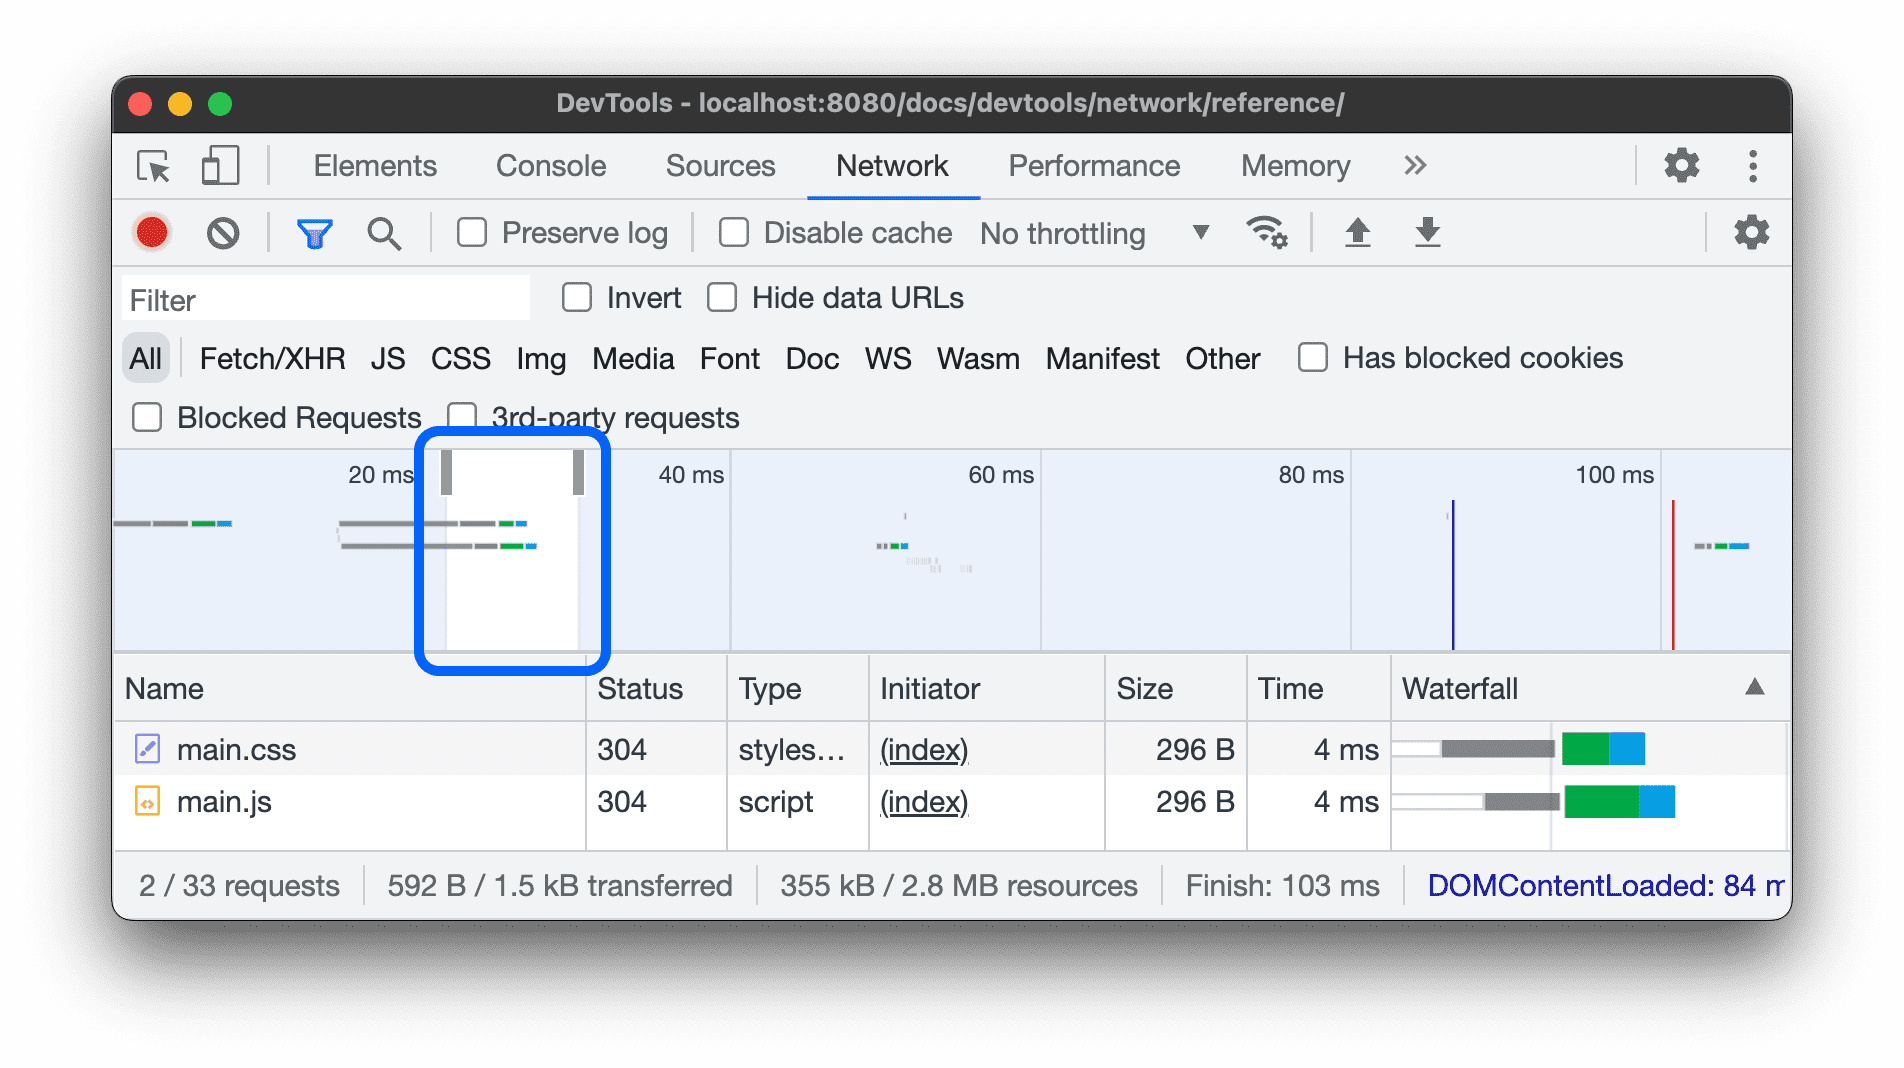
The Network panel helps you monitor network requests made by your webpage, including XHR and fetch requests.
How to Use:
- Open Network Panel: Click on the "Network" tab.
- Record Network Activity: By default, network activity is recorded when you open the Network panel. You can clear the log by clicking the clear button (⛔).
- Inspect Requests: Click on any request to see detailed information, including headers, payload, and response.
- Filter Requests: Use the filter box to filter requests by type (e.g., XHR, CSS, JS).
- Throttling: Simulate different network conditions (e.g., offline, slow 3G) using the throttling dropdown.
Tips:
- Use the "Preserve log" checkbox to retain network information across page loads.
- Check the "Disable cache" option to ensure you're seeing the latest version of your resources during development.
4. Debugger (Sources Panel)
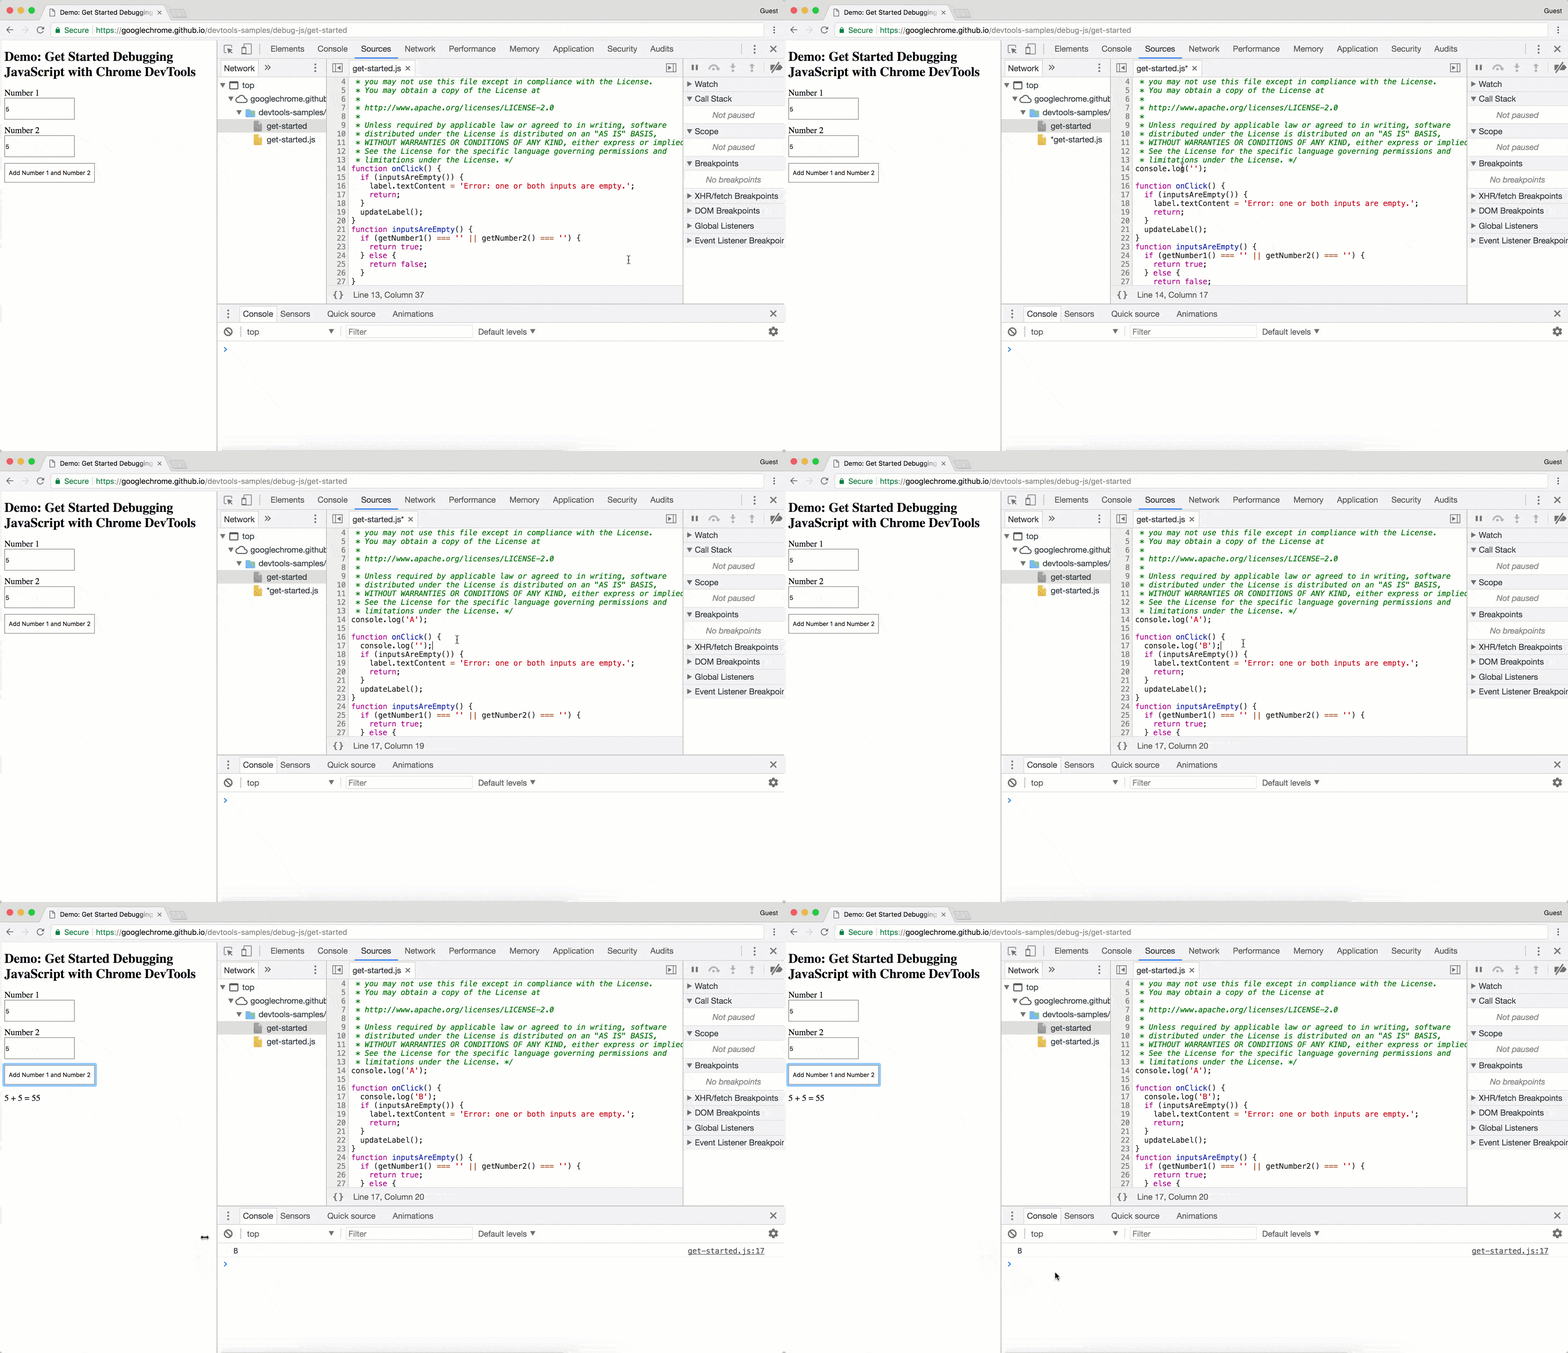
The Sources panel allows you to debug your JavaScript code by setting breakpoints, stepping through code, and inspecting variables.
How to Use:
- Open Sources Panel: Click on the "Sources" tab.
- Set Breakpoints: Click on the line number in your JavaScript file to set a breakpoint.
- Step Through Code: Use the controls to step over, step into, or step out of functions.
- Watch Expressions: Add variables or expressions to the "Watch" pane to monitor their values as you step through code.
- Call Stack: View the call stack to understand the sequence of function calls leading to the current point in execution.
Tips:
- Use conditional breakpoints by right-clicking on a line number and selecting "Add conditional breakpoint."
- Use the "blackbox" feature to ignore third-party scripts during debugging.
5. Application Panel
The Application panel provides tools to inspect and manage storage, including cookies, local storage, session storage, and indexedDB.
How to Use:
- Open Application Panel: Click on the "Application" tab.
- View Storage: Expand the "Storage" section to view cookies, local storage, session storage, indexedDB, and other storage options.
- Edit Storage: You can add, edit, or delete storage items directly.
- Service Workers: Manage service workers and view their status.
- Manifest: View and inspect your web app manifest file.
Tips:
- Use the "Clear storage" option to clear all storage for your application, which can be useful for testing.
- Inspect and debug Progressive Web Apps (PWAs) using the Service Workers and Manifest sections.
Conclusion
Debugging is an essential skill for any web developer. By mastering the use of Chrome and Edge Developer Tools, you can efficiently identify and fix issues in your code, improve the quality of your applications, and enhance the user experience. Follow the best practices outlined in this guide, and you'll be well on your way to becoming a debugging pro.

Article by s1lent
Published 17 Jul 2024